One core problem on a regulated digital asset book is platform blindness: the asset is live, but ops cannot tell whether the stack will process the next instruction.
Before settlement, risk or transfers move, the institution needs a current read on API health, chain usability, index lag and whether transactions are progressing. DALP 3.0 puts that read in the product as Platform Status. Ops see the Platform API and the chains in the deployment in one place, with enough detail to decide the next step.
In earlier setups, checking platform health meant leaving the product. Someone opened an infrastructure console, hunted for the right panel, translated the graph into a decision, then came back. Under operational SLAs that delay adds risk, and it is easy to skip when the book is busy. Metrics are usually available somewhere. What is often missing is a view inside the product, written for the person running a redemption window rather than for an infrastructure team.
How the monitoring layers fit together
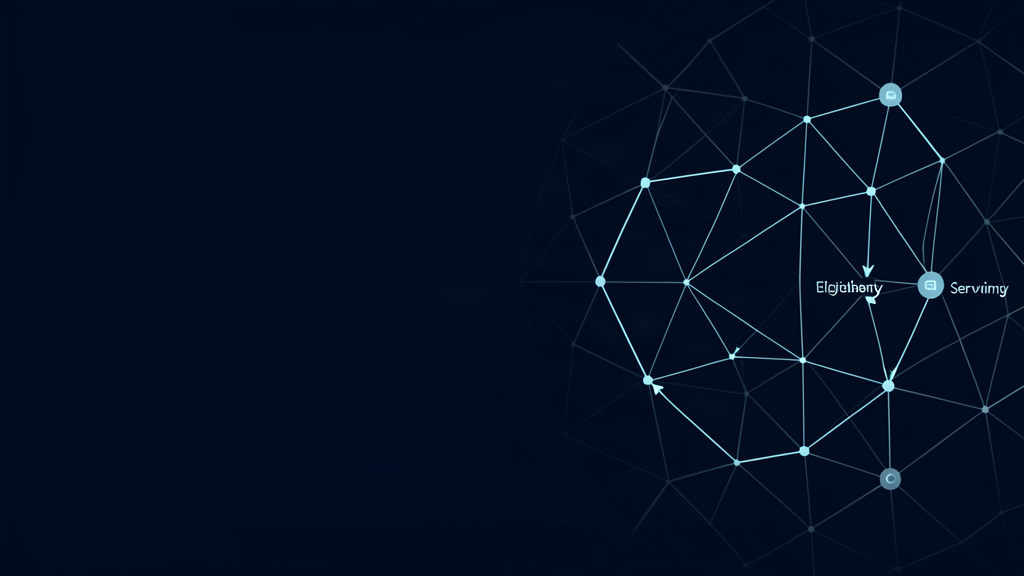
DALP 3.0 monitoring has three layers and one rollup.
API monitoring watches request volume, endpoint health, error rates and trends on Platform API traffic from the console, integrations and platform-initiated calls.
Blockchain monitoring watches RPC health, indexer state, sync lag, service health and empty-block periods on each chain in the deployment.
Platform Status combines both. It reports operational, degraded or outage, and shows which panel is driving the state.
The layers do different jobs. The API layer answers whether requests are succeeding. The chain layer answers whether new transactions can still land. The rollup is what ops actually need under pressure: given both reads right now, can asset operations proceed?
Full product detail lives in the DALP 3.0 monitoring documentation.
API monitoring at the platform boundary
The Platform API sits between day-to-day operations and the work the platform runs on their behalf. Transfer instructions, compliance checks and workflow triggers go through it. Failures in an integration or in the platform usually show up here first.
Traffic is grouped by endpoint, so a jump in 4xx on one route, timeouts on a workflow path or a sustained run of 5xx responses is obvious without raw log diving. Console traffic, integration traffic and platform-initiated calls appear in the same surface as the assets they affect.
Thresholds are set so quiet days and busy days do not produce fake crises. At high volume, an endpoint outage needs the 5xx rate above 5% of requests. That filters out isolated client errors. Below 500 daily requests, rates mislead (one failure can look like total collapse), so the panel switches to absolute counts. Fifty or more 5xx responses flag an outage for the day. No traffic yields a no-data state instead of a green that means nothing. Day summary and live snapshot use the same rules, so a morning reading matches what the prior evening would have shown.
Blockchain monitoring when the chain has to stay usable
If the book runs on-chain assets, the institution is also on the hook for the chains those assets sit on. A block stall, a weak RPC path or an indexer lagging the head can stop settlement, leave compliance reads stale or block a scheduled redemption. The API can still return clean responses while the chain itself cannot accept new work.
Blockchain monitoring gives a panel per chain for RPC health, indexer state, sync lag and service health, without leaving the product. When infra dashboards are still required, deployment guidance names the panels to open rather than forcing a search.
Empty-block detection separates a quiet network from a stalled one. Private and consortium chains often produce blocks on a clock even with no user activity, so short empty runs can be normal. Pass the documented threshold for that chain and the panel moves from idle to blocked, so ops stop waiting and start fixing. Below the threshold it stays quiet on low-traffic chains.
Indexer lag is shown as time behind the latest indexed snapshot, and as how many entries still remain before the head. Slow-block chains can look deep in blocks yet only slightly late in wall clock. Fast-block chains can invert that. A compliance check run against data that is forty blocks old may miss a freeze or allowlist change that already happened. The panel makes the lag plain so ops can wait for catch-up or chase the cause.
Platform Status rollup
Platform Status reads both layers and lands on one of three states:
- Operational: monitored services are inside normal bounds
- Degraded: something is outside bounds, but work can continue
- Outage: transactions cannot progress; intervention is required now
Four panels feed that rollup. Data freshness covers indexer sync and currency, including recent sync error counts. Transactions cover in-flight and recent activity health. Platform API covers volume with 4xx and 5xx rates. Workflows cover engine health, queue depth and stalled workflow count. Each panel has its own verdict. The overall status takes the worst of them. If three panels are clean and one is outage, the rollup is outage. The signal that caused the state stays visible. Panels load on their own so a slow source does not freeze the rest. A panel that cannot load falls back to no-data instead of hanging the page.
Integrations read the same signals through per-panel endpoints. A consumer that only watches data freshness does not wait on workflow engine results. The older snapshot route still works for one release while callers move to the dedicated panel paths.
How ops and risk use it
During transfers, redemptions, approvals and settlement windows the layers can diverge. The API may look fine while the chain is not ready for new activity. Platform Status shows that split early enough to protect the book. Ops and risk can decide whether to continue, hold instructions that depend on the unhealthy plane, or open an investigation from the panel that flipped.
For people accountable for the book, that is operational control inside the product, not a second set of dashboards assembled in a hurry.
See the monitor platform status runbook and the platform-status API. For the wider release context, start with the DALP platform overview. Related DALP 3.0 notes cover custody and signing and durable transactions and ledger history.
Frequently asked questions
Platform Status rolls API monitoring and blockchain monitoring into one operational, degraded or outage verdict, with panel detail for the signals behind the state. Ops can see whether asset work can proceed without leaving the product.
API monitoring covers request volume, endpoint health, error rates and trends on Platform API traffic. Blockchain monitoring covers RPC health, indexer state, sync lag, service health and empty-block periods on each chain. Platform Status combines both into the rollup.
Yes. Clean API success rates can sit next to a stalled settlement chain or an indexer lagging the head. Platform Status puts both reads in one view so that split is visible.
Short empty-block runs can be normal on quiet chains. Once a run exceeds the documented threshold for that chain, the panel moves from idle to blocked so ops can act. Below the threshold the panel stays quiet.
Independent panels cover data freshness, transactions, Platform API health and workflows. Overall status is the worst panel state, and the driving signal remains visible. Panels load separately so one slow source does not block the others.
Yes. Integrations can call per-panel platform-status endpoints under the Platform API for data freshness, transactions, platform API metrics, workflows and summary cards. The older snapshot endpoint remains available for one release during migration.
Want to discuss how Platform Status fits your digital asset operating model?
Book a call with our team ↗
About SettleMint
SettleMint, headquartered in Leuven, Belgium, with offices in UAE, Singapore and Japan is the company behind DALP, the entirely composable Digital Asset Lifecycle Platform. DALP enables financial institutions, market infrastructure operators, and governments to build, deploy, and manage digital assets and blockchain applications at scale.